How Do You Handle Data In Analytics To Gain Greater Insights
Handling data in analytics for greater insights involves a systematic approach encompassing defining objectives, collecting and cleaning data, conducting exploratory data analysis (EDA), and employing advanced techniques like feature engineering and modeling.
Python, with libraries like Pandas and Matplotlib, is commonly used for data manipulation and visualization. Addressing challenges such as imbalanced datasets, time-series considerations, data privacy, and feature scaling enhances the robustness of analytics. The iterative nature of the process emphasizes continuous refinement and documentation for reproducibility and transparency.
To find more, let’s scroll more.

Handling Data In Analytics And Gaining Greater Insights
Handling data in analytics to gain greater insights involves a systematic approach that includes data collection, cleaning, analysis, and visualization. Here’s a general guide on how to handle data in analytics:
Define Objectives and Key Questions
Clearly defining objectives and key questions is the foundational step in any data analytics process. This involves understanding the business problem at hand and identifying the specific insights or decisions stakeholders are seeking.
For example, if the objective is to improve customer satisfaction, key questions may revolve around factors influencing satisfaction, such as product features, customer support interactions, or delivery times. This step provides a roadmap for subsequent data collection and analysis, ensuring that efforts are focused on addressing the most critical aspects of the problem.
Once objectives are well-defined, it’s essential to prioritize key questions to guide the analytics process effectively. This involves assessing the business impact and feasibility of answering each question.
Data Collection
Data collection is a critical phase where relevant information is gathered to address the defined objectives and key questions. Depending on the nature of the analysis, data may be sourced from internal databases, external APIs, spreadsheets, or other structured and unstructured sources.
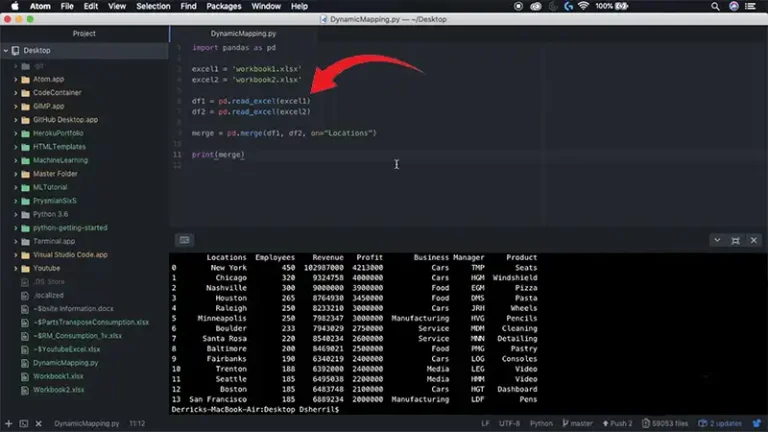
In addition to obtaining the necessary data, it’s crucial to consider the ethical implications of data collection, ensuring compliance with privacy regulations and obtaining informed consent when necessary. Establishing a robust data governance framework at this stage contributes to the overall reliability of the analytics process. Python is easy and handy here, let’s see:
import pandas as pd
import numpy as np
# Load your dataset
df = pd.read_csv('your_dataset.csv') # Handling missing values
df.dropna(inplace=True) # Alternatively, use df.fillna() for imputation # Outlier detection and treatment
def remove_outliers(data, threshold=3):
    z_scores = np.abs((data - data.mean()) / data.std())
    outliers = (z_scores > threshold).all(axis=1)
    return data[~outliers]
df = remove_outliers(df['your_numeric_column'])
# Standardizing units or converting data types
df['your_numeric_column'] = df['your_numeric_column'].astype(float) # Removing duplicates
df.drop_duplicates(inplace=True) # Data validation rules
# Assuming ‘age’ should be positive
df = df[df['age'] >= 0] # Data cleaning is an iterative process, and you might need to repeat these steps based on analysis feedback.
The collected data serves as the raw material for insights, making the meticulous and thoughtful approach to data collection pivotal in the success of the analytics initiative.
Exploratory Data Analysis (EDA)
Conduct exploratory data analysis to understand the structure, patterns, and relationships within your data. Use statistical and visual techniques to identify trends, correlations, and potential insights.
Inconsistencies in data formats or units are addressed during the cleaning process. This may involve standardizing units, converting data types, or resolving discrepancies in coding schemes. Duplicate records are identified and removed, ensuring the dataset is free from redundancy. Data validation rules are applied to check for errors in data entry, ensuring data accuracy.
The use of programming languages such as Python or R, along with libraries like Pandas, facilitates these tasks, providing functions for data manipulation, cleaning, and validation. Automated scripts can be developed to streamline the cleaning process and ensure consistency across multiple datasets. A Python example goes as:
import matplotlib.pyplot as plt
import seaborn as sns
# Summary statistics
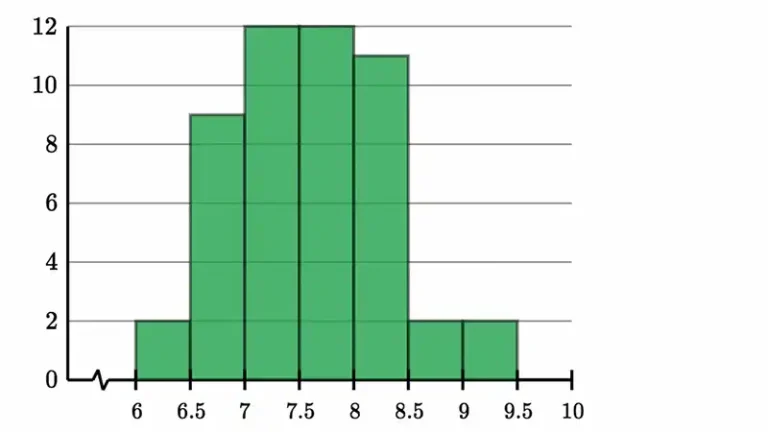
print(df.describe()) # Visualizing distribution of variables
sns.histplot(df['your_numeric_column'], kde=True)
plt.show()
# Correlation matrix
correlation_matrix = df.corr()
sns.heatmap(correlation_matrix, annot=True, cmap='coolwarm')
plt.show()
# Scatter plot for relationship exploration
sns.scatterplot(x='feature1', y='feature2', data=df)
plt.show()
# Dimensionality reduction (Principal Component Analysis – PCA)
from sklearn.decomposition import PCA
pca = PCA(n_components=2)
reduced_features = pca.fit_transform(df[['feature1', 'feature2']])
plt.scatter(reduced_features[:, 0], reduced_features[:, 1])
plt.xlabel('Principal Component 1')
plt.ylabel('Principal Component 2')
plt.show()
# Time series analysis
# Assuming ‘timestamp’ is a datetime column
df['timestamp'] = pd.to_datetime(df['timestamp'])
df.set_index('timestamp', inplace=True)
df['your_numeric_column'].plot()
plt.xlabel('Timestamp')
plt.ylabel('Your Numeric Column')
plt.show()
Advanced techniques, including data imputation algorithms such as k-nearest neighbors or machine learning-based methods, can be employed for more sophisticated cleaning tasks. Additionally, data quality frameworks, like Great Expectations, can be integrated to automate and maintain data quality over time.
Feature Engineering
Create new features or transform existing ones to enhance the information available for analysis. This can involve creating ratios, aggregating data, or extracting relevant information from existing variables.
Data Transformation
Normalize or scale your data as needed. Transformation techniques like log transformations or standardization can make certain patterns more apparent and improve the performance of some analytical models.
Data Modeling
Apply appropriate analytical models or algorithms based on your objectives. This could include regression analysis, machine learning algorithms, or other statistical methods depending on the nature of your data and the questions you want to answer.
Validation and Testing
Validate your models using appropriate techniques, such as cross-validation or splitting your data into training and testing sets. This helps ensure that your models generalize well to new, unseen data.
Interpretation of Results
Interpret the results of your analysis in the context of your objectives. Clearly communicate the findings, insights, and any limitations of your analysis.
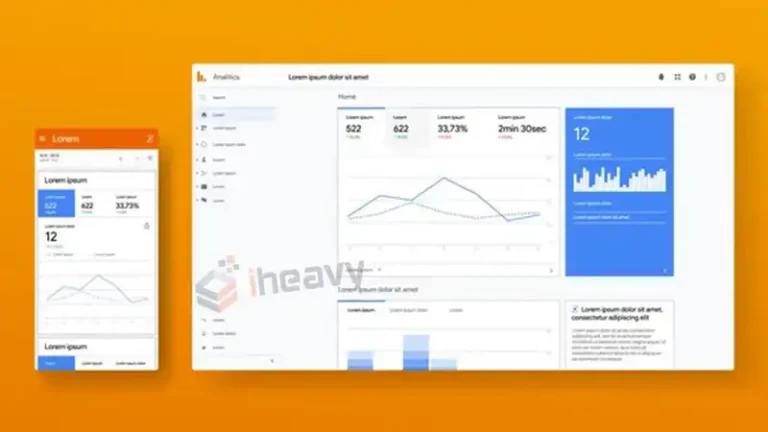
Data Visualization
Create visualizations to communicate your insights effectively. Visualizations can make complex patterns more accessible and help stakeholders understand the implications of the data.
Iterative Process
Analytics is often an iterative process. Review your findings, refine your models, and explore additional aspects of the data to deepen your understanding and uncover new insights.
Documentation
Document your methodology, assumptions, and any decisions made during the analysis. This documentation is important for reproducibility and for others to understand and trust your results.
Frequently Asked Questions
How do you handle imbalanced datasets in analytics?
Answer: Imbalanced datasets can be addressed using techniques like oversampling, undersampling, or synthetic data generation (SMOTE). The impact includes biased model metrics, emphasizing the need for evaluation metrics that consider both classes.
What considerations are crucial for working with time-series data in analytics?
Answer: Time-series analytics requires addressing seasonality, trends, and autocorrelation. Techniques like differencing and decomposition can handle these patterns. Temporal cross-validation ensures model generalizability.
How can data privacy be ensured in analytics, especially with sensitive information?
Answer: Data privacy involves measures like anonymization, encryption, and access controls. Differential privacy techniques protect individual privacy, and compliance with data protection regulations is crucial.
Concluding Remarks
Remember that gaining greater insights from data is an ongoing process, and staying curious and open to exploring new angles is essential. Moreover, adapt the code to your specific dataset and analysis goals, and use comments to document your decisions and assumptions.