Power BI Member vs Contributor

Power BI Member vs Contributor

Power BI is an essential tool for organizations aiming to harness the power of their data through visualization and reporting. To ensure effective collaboration, Power BI provides different roles within its workspaces. Two key roles that often come into play are Member and Contributor.  Understanding the distinctions between these roles is crucial for anyone involved…

Why is My JavaScript Class Not Working?

Why is My JavaScript Class Not Working?

JavaScript classes, introduced in ECMAScript 6 (ES6), provide a more straightforward and syntactically appealing way to create objects and manage inheritance.  However, there are instances when you may run into issues where your JavaScript classes don’t work as expected. This article will explore some common pitfalls and how to resolve them. How Class Works in…

Scheduler Configuration: A Comprehensive Guide

Scheduler Configuration: A Comprehensive Guide

Schedulers play a crucial role in executing tasks or jobs at predetermined times or intervals. Configuring a scheduler correctly is essential for ensuring that these tasks are performed efficiently and on schedule.  This article will explore various methods of configuring schedulers, provide practical examples, and address common questions in the FAQ section. What is a…

How to Clean and Preprocess Big Data Sets for Accurate Analysis

How to Clean and Preprocess Big Data Sets for Accurate Analysis

Data is the new oil. However, raw data is like crude oil – it needs refining before it becomes a valuable product. This refinement process is known as data cleaning and preprocessing. For big data, this process is even more critical due to its sheer volume and complexity. Data cleaning and preprocessing are crucial steps…

Troubleshooting the “Docker Command Not Found” Error

The “docker command not found” error is a common issue encountered by users trying to run Docker commands on their systems. This error can arise from several causes, including incorrect installation, misconfigured paths, or even permissions issues.  This article provides comprehensive steps for troubleshooting across different operating systems, ensuring that you can get Docker up…

Learning the pandas.DataFrame.loc Method

Learning the pandas.DataFrame.loc Method

The Pandas library is an essential tool for data manipulation and analysis in Python. One of the most powerful features of pandas is its ability to efficiently access and manipulate data using the .loc indexer.  Whether you are working with small datasets or large, complex data structures, understanding how to effectively use .loc is a…

The Complete Azure Security Checklist

The Complete Azure Security Checklist

As businesses increasingly rely on cloud infrastructure, ensuring the security of your Azure environment is no longer an option but a necessity. A data breach can lead to significant financial losses, reputational damage, and legal repercussions. To safeguard your valuable assets, a comprehensive Azure security checklist is indispensable. The subsequent sections will delve into the…

How to Identify Parameter Sniffing in SQL Server

Parameter sniffing is a performance optimization technique in SQL Server where the query optimizer uses the values of parameters passed to a stored procedure during compilation to generate an execution plan.  While this is generally beneficial, it can sometimes lead to performance issues if the initial parameter values are not representative of the typical workload….

How to Comment Out Multiple Lines in Python Shortcut 
|

How to Comment Out Multiple Lines in Python Shortcut 

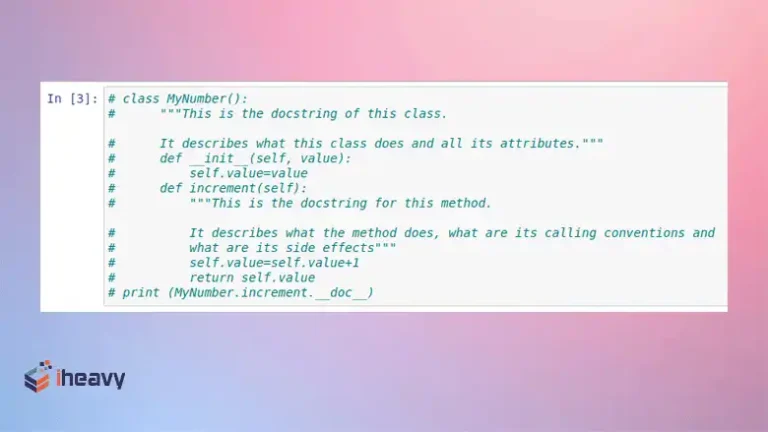
Commenting is an essential practice in programming. It allows developers to annotate code, making it easier to understand and maintain. In Python, comments are marked by the hash symbol (#).  While commenting out single lines is straightforward, commenting out multiple lines can take more time than required when not using the right techniques. In this…

Data Visualization in R | A Beginner’s Guide

Data Visualization in R | A Beginner’s Guide

Data visualization is a crucial aspect of data analysis and interpretation, allowing us to see patterns, trends, and insights that might not be apparent from raw data alone. R, a powerful statistical programming language, provides a vast array of tools and libraries to create a wide range of visualizations.  In this article, we will explore…