Query to Check CPU Utilization in SQL Server | A Comprehensive Guide
CPU utilization monitoring is essential to identify potential bottlenecks and optimize SQL Server performance. High CPU usage can slow down queries, cause timeouts, and impact overall application performance. Efficiently managing CPU resources ensures that the server can handle concurrent user requests and process queries promptly.
Here, we are going to explore queries that allows you to check the CPU utilization in SQL Server, helping you identify and address any performance issues.
Querying CPU Utilization in SQL Server
SQL Server provides various methods for monitoring CPU utilization, including dynamic management views (DMVs), SQL Server Management Studio (SSMS), and Performance Monitor. DMVs offer a granular view of CPU usage metrics, while SSMS and Performance Monitor provide user-friendly interfaces for visualizing and analyzing CPU usage data.
Using Dynamic Management Views (DMVs)
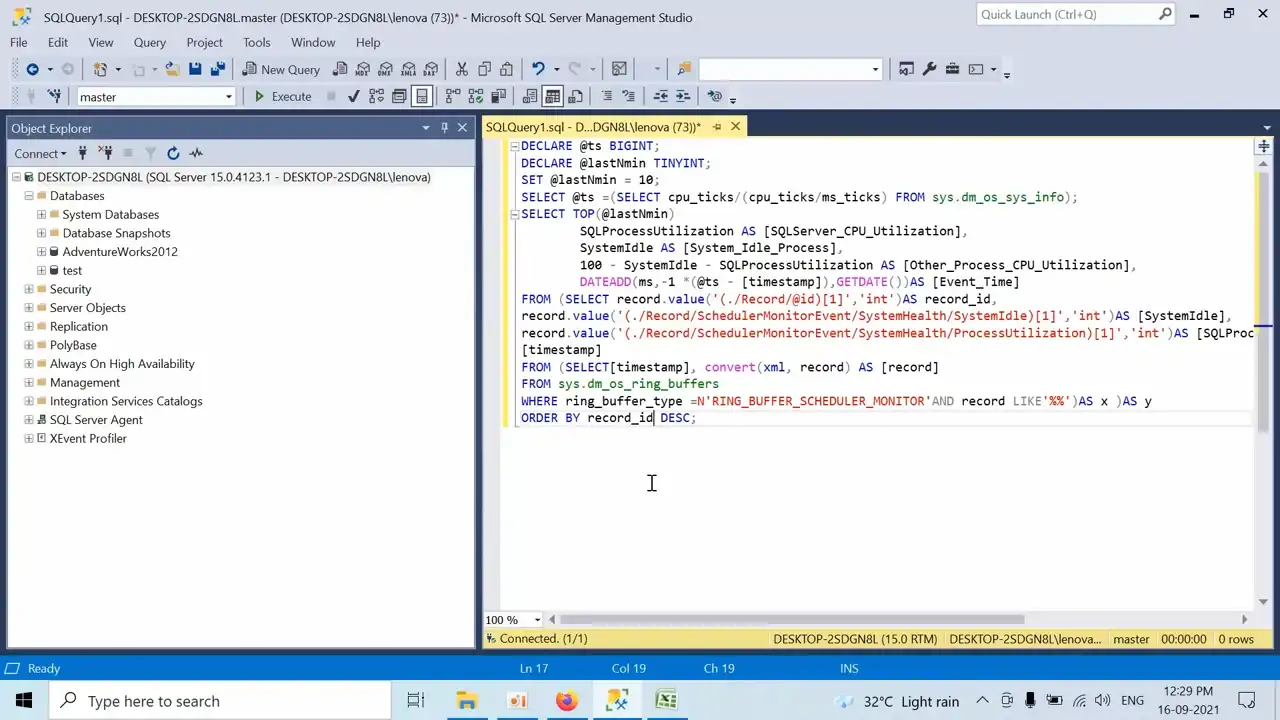
DMVs offer a direct way to query real-time CPU usage information. The sys.dm_os_ring_buffers DMV provides a comprehensive set of metrics for CPU usage, including user time, privileged time, and total CPU time.
To query the sys.dm_os_ring_buffers DMV, use the following command:
| SELECT * FROM sys.dm_os_ring_buffers |
This query will return a table containing various CPU usage metrics, including:
- cpu_time: Total CPU time consumed by SQL Server processes
- user_time: CPU time spent in user mode
- privileged_time: CPU time spent in privileged mode
You can also filter the results to specific SQL Server instances or time intervals using the instance_name and timestamp columns.
Using SQL Server Management Studio (SSMS)
SSMS provides a graphical interface for monitoring CPU usage in SQL Server. To access CPU usage information in SSMS, follow these steps:
- Connect to the SQL Server instance you want to monitor.
- Expand the Management node in the Object Explorer.
- Right-click the Performance node and select Counters.
- In the Select Counters dialog box, select the Processor category and choose the % Processor Time counter.
- Click Add and then OK.
SSMS will display a real-time graph of CPU utilization for the selected SQL Server instance.
Using Performance Monitor
Performance Monitor is a Windows tool that provides comprehensive monitoring capabilities for various system resources, including CPU usage. To monitor CPU usage in the Performance Monitor, follow these steps:
- Open Performance Monitor.
- In the left pane, expand the Counters node and select the SQL Server:SQL Server <Instance Name> node.
- In the right pane, double-click the % Processor Time counter.
Performance Monitor will display a real-time graph of CPU utilization for the selected SQL Server instance.
Additional Considerations
When monitoring CPU utilization, it’s important to consider the following factors:
- Baseline CPU usage: Establish a baseline CPU usage level for your SQL Server instance under normal operating conditions. This will help you identify when CPU utilization is abnormally high.
- CPU spikes: CPU spikes can occur due to temporary workload bursts or inefficient queries. Investigate the cause of CPU spikes to identify potential bottlenecks or performance issues.
- Long-term trends: Monitor CPU usage trends over time to identify gradual increases or decreases that may indicate underlying performance issues or hardware limitations.
By regularly monitoring CPU utilization and analyzing trends, you can proactively identify potential performance problems and take corrective measures to maintain the optimal performance of your SQL Server instance.
Best Practices for CPU Utilization Optimization
Optimizing CPU utilization involves various strategies:
- Query Optimization: Refine and optimize high CPU-consuming queries by improving indexing, rewriting, or utilizing query execution plans.
- Indexing Strategy: Ensure appropriate indexing on tables to reduce unnecessary resource consumption during query execution.
- Resource Governor: Implement Resource Governor to allocate CPU resources effectively and prioritize critical workloads.
- Regular Performance Monitoring: Continuously monitor CPU utilization using DMVs to identify trends and take proactive measures.
Frequently Asked Questions
Is there a single query to pinpoint problematic CPU usage in SQL Server?
While there isn’t a one-size-fits-all query, combining various DMVs like `sys.dm_os_performance_counters` and `sys.dm_exec_query_stats` can offer comprehensive insights into CPU usage.
How frequently should I monitor CPU utilization in SQL Server?
Regular monitoring is advisable, especially during peak usage times or after significant changes to the database, to detect and address performance issues promptly.
What does high CPU utilization in SQL Server indicate?
High CPU utilization often signifies heavy workload, poorly optimized queries, inadequate indexing, or insufficient hardware resources.
To Conclude
Monitoring CPU utilization in SQL Server is crucial for optimal performance and identifying bottlenecks. Real-time CPU utilization metrics can be retrieved through a query, but interpretation should be done considering server specifications and workload. Continuous monitoring enhances SQL Server environment stability.